|
|
|||||||||||
Decision Tree Classifier SoftwareDecision tree classifier is a predictive model that, as its name suggests, is presented in a tree. Decision making process is presented in a tree format. The following figure shows an example of decision tree which determines/predicts gender of employees. For space efficiency, the tree is drawn left-to-right, as compared to common top-to-bottom representation. The tree is a model that predicts "GENDER" of of employees based on values of "JOBPOST", "SALARY", "RACE", etc. In another words, given values of "JOBPOST", "SALARY", "RACE", etc., of an employee, the tree predicts "GENDER" of the employee. 
The left most node "WHOLE" is the root of the tree. At the second level, the root node is divided into five sub-branches based on the values of the variable "JOBPOST". Note that areas of rectangles indicate gender value distribution in nodes. Blue is for "Male" and red is for "Female". The root node shows evenly gender distribution, i.e., 51.5% is male and the rest female. After the split at the second level, nodes show more biases towards a certain gender. The middle three nodes are heavily populated with males. So they are predicted as males. The first node does not show much change in gender distribution. So it is further divided based on "RACE". Further dividing the node "RACE=Ethnic" does not yield improvement in gender distribution. So the node no longer divided. On the other hand, dividing the node "RACE=White" based on the salary boundary at $30,000 results in sub-nodes rich with female and male populations respectively. Similarly, the bottom node of the second level is divided twice, producing terminal nodes rich in female and male populations respectively. Terminal nodes represent predictions or decisions. Decisions at terminal nodes are made based on most frequent categorical values, in this case, "GENDER". If a terminal node has more male population, decision is made to "Male". Otherwise to "Female". Decision trees having terminal nodes dominated by a single class lead to higher accuracy. A perfect decision tree with prediction 100% accuracy will consist of terminal nodes having population of the same categorical values. For example, either all males or all females. Normally this ideal distribution does not exist. So accuracy of decision trees falls!
Decision Tree as a Drill-down Segmentation ToolDecision tree divides populations into smaller segments repeatedly. At a node, it selects a single variable in such a way that values of the variable boost proportions of the largest categorical value in each resulting segments. If the population is insurance policies, each segmentation will try to increase the proportion of either "never-claimed" or "claimed" customers. This tends to lead segments with higher portion of claimed policies. Similar analogy applies to other application areas such as credit, finance, direct mail catalog responses, customer churns, and so on. There are many applications that this type of hierarchical segmentation is useful. 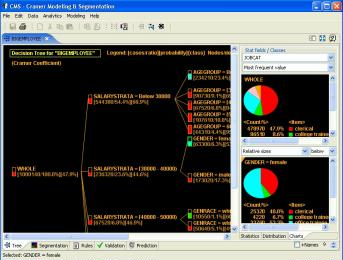
Statistical information of nodes is shown at the right-hand side of the window. It includes pie charts and histograms. For the insurance example, reds may represent "claimed" customer portions and greens for "never-claimed" customers. Nodes in red indicate that over 50% customers of the segments have claims. Green nodes have less than 50% of claim customers. In addition to red nodes, nodes with lower height green bar may be of interest. Note that they represent relatively higher proportions of risky customers. As you can see from the figure, it's very easy to identify segments using various statistical gauges of StarProbe/CramerTree. Visualization includes the following information;
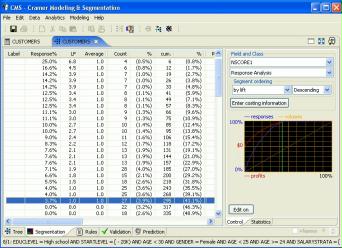
Marketing Response Analysis with Gains & Profit ChartsBreakdown of populations into smaller segments induces segments having concentration of certain values. This provides means for cost-effective customer selection methods. For example, for catalog marketing, segments can be visualized with a special response and profit gains chart as shown at the right figure. The blue curve indicates response capture ratios. The green curve shows quantity (or volume) capture ratios. Similarly, the red curve describes profit and loss amounts. Steep rising curves at the left end are a good indication of good segmentation, since selecting a small number of left-end customer segments can capture most potential responses. This will lead to a small number of catalog mailings, and therefore result in efficient marketing campaigns. For more, read Direct Mail Catalog Marketing.
For information about software, please read Data Mining Software. Software download is available from the page. |

|
||||||||||