|
|
|||||||||||||
Time-series Analysis and RegressionTime-series data is a sequence of information collected over periodic intervals such as daily, weekly, monthly, quarterly, half-yearly, yearly, hourly, and so on. Time-series regression is an analytic technique used in developing predictive models for time-series data. It automatically derives mathematical functions that summarize trends embedded in time-series data. In the following monthly time-series chart, notice that there are two patterns. First, sales has upward growth trend. Second, sales fluctuates depending on seasons. These two patterns can be captured by time-series regression with seasonal adjustment as described in the subsequent sections. 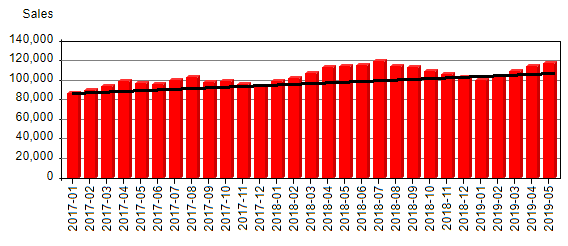
Linear Growth Estimation by Linear Time-series RegressionLinear growth can be best understood with a linear function. Linear regression formula is stated as "Y = a + b * X" where "b" is the periodic average increase/decrease amount. "b" is the "Linear growth rate". The red line in the following figure shows the linear regression line. "b" represents the linear average growth amount. This method of growth computation is best for linear growth data. If data is not linear, non linear functions should be used. 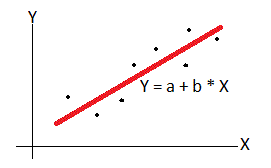
Time-series Forecasting with Seasonal AdjustmentTime-series sequence data often contain seasonal patterns. For example, clothing and fruits sales can fluctuate based on season. This hides underlying sales patterns and makes it difficult to project sales figures accurately. Seasonal adjustment is used to overcome this problem. It removes seasonal factors. Time-series regression on seasonally adjusted data can capture hidden patterns. Predicted values on seasonally adjusted data are then converted back to actual values. This process can significantly improve accuracy of predictions. It is noted that to make seasonally adjusted sales forecasting works, multi-year series data is required. At least three years data is recommended. Sales trend analysis with seasonal adjustment is very complex. Use of analytic software is essential. The following figure is a CMSR Data Miner line chart with seasonally adjusted forecasting. Slim lines represent original time-series data. +++ lines are seasonally adjusted data. Dashed lines are projected data by regression on seasonally adjusted data and reversing seasonal adjustment.
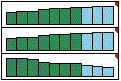
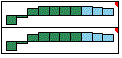
Alternative to regression method is neural network. Neural network can include additional factors in modeling. For more, please read Time-series Analysis and Forecasting with Neural Network. Time-series Similarity AnalysisThe following figures show seven time-series trend charts. Consider the three time-series trends of the left figure. The first two series have identical positive growing trends. As the first series values rise, the second series values also rise. The third has opposite trend. As the values of the first series rises, the values of the third series decrease. This type of co-relationship is very common in business data. These three are correlated! The first and the second are positively correlated. The third is negatively correlated with the first and the second. Now consider the two series of the middle figure. Although not related in linear fashion, two values rise and fall together. That is, they are also closely correlated.
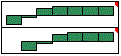
Consider the two series of the right figure. Notice that the second series values resemble the first series values with one period later. That is, one period time shift or time lag pattern. Second pattern occurs after one period lag. This this is also very important co-relationship. Time-series Analysis and Forecasting Tools of CMSR Data MinerCMSR Data Miner provide three time-series analysis and forecasting tools: (1) time-series analysis, (2) group-by report, and (3) line chart (as shown above). All three tools support time-series analysis with seasonal adjustment. Time-series analysis tool and group-by report are designed for vertically and horizontally organized time-series data respectively. Line chart adds graphical visualiaztions. The following figures show time-series analysis tool and group-by report examples;
Time-series regression is very easy with CMSR Data Miner. Just choose options as in the following dialog;
|

|
||||||||||||