|
|
|
Home | Business Intelligence | Data Mining | Rosella DBMS | Products & Downloads | Site Map | Contact Us | |
Web-based Business Intelligence - How does it work?WOA - Web Oriented Architecture - refers to the approach delivering compartmentalized information through web. WOA is a new trend for Business Intelligence and OLAP. Data is stored in database management systems. Run configurations specify database information and processing environments such as reporting and charting parameters. External web services may refer BI services using <A HREF="..."> and <IMG SRC="..."> HTML tags indirectly. Alternatively, users may access information directly. Subsequent sections describe how information is delivered to user's web browsers.
Direct links: <A HREF="...">Direct links are specified using <A HREF="..."> tags. In direct link mode, reports and charts are automatically generated based on available information in a specified run configuration. The followings show URL coding examples;
     <a href="rmedbbrowse?exec=sales_data.txt"> Browse </a>
     <a href="http://myserver.domain.com/olap/rmedbgroupby?exec=sales_data.txt"> Groupby </a>
     <a href="http://myserver.domain.com/olap/rmedbcrosstab?exec=sales_data.txt&field=sales"> Crosstab </a>
     <a href="rmedbpiechart?exec=sales_data.txt&field=pie1"> Pie charts </a>
     <a href="rmedbbarchart?;exec=sales_data.txt&field=bar3"> Bar charts </a>
Image links: <IMG SRC="...">Direct links generate new html pages that may contain graphic images. Then graphic images are requested separately by web browsers. However, you may wish to generate graphic images directly using image tags. Image link is a special extension of direct links. Instead of <A HREF=""> tags, it uses <IMG SRC=" "> tags. The followings are examples of image links;
     <IMG SRC="rmedbpiechart?draw=sales_data.txt&field=pie1">
     <IMG SRC="http://myserver.domain.com/olap/rmedbbarchart?;draw=sales_data.txt&field=bar3">
     <IMG SRC="rmedbgaugechart?draw=sales_data.txt&field=guage1&width=200&height=120">
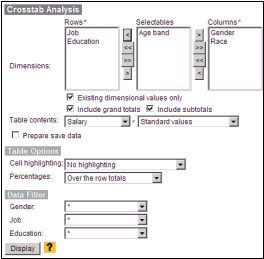
Interactive mode for Ad-hoc analysisIn interactive mode, users are presented with a selection panel where they can select or add additional information. The following figure shows a selection panel for pie charts; 
The followings show URL coding examples;
     <a href="rmedbbrowse?conf=sales_data.txt"> Browse </a>
     <a href="rmedbgroupby?conf=sales_data.txt"> Groupby </a>
     <a href="http://myserver.domain.com/olap/rmedbcrosstab?conf=sales_data.txt"> Crosstab </a>
     <a href="http://myserver.domain.com/olap/rmedbpiechart?conf=sales_data.txt"> Pie charts </a>
     <a href="rmedbbarchart?;conf=sales_data.txt"> Bar charts </a>
Embedded HTML PagesHTML pages embedded with analytic components provide rich analytic information. Embedded html pages are the same as normal html pages except that they may contain special tags representing analytic components. Special tags can be inserted into any part of html pages. The current version supports the following tags;
     $$COMPONENT{ arguments }$$
     $$RMETABLE{ arguments }$$
     $$IFEMPTY{ block expressions }$$
     $$IFNOTEMPTY{ block expressions }$$
     $$LOOP{ block expressions }$$
     $$BLOCK{ block expressions }$$
     $$P{ arguments }$$
The "$COMPONENT{ }$$" tag is to add a standalone embedded component at the specified position. The "$RMETABLE{ }$$" tag is to create an RME table whose values may be obtained using the "$P{ }$$" tag. The next three tags are used in performing conditional operations over RME tables. The "$BLOCK{ }$$" tag can used to create a scope for conditional operations. Details are described in the subsequent sections. The following example uses a multiple-row table. First, the "$$RMETABLE{ }$$" is executed to generate groupby table that may return a number of rows. For each row of the table, the second block will be applied repeatedly. Parameters tags will use values of different rows in each iteration, creating a html table of records;
$$RMETABLE{"rmedbgroupby"; "data_channels.txt";
         "$$P{q()}$$Region$$P{q()}$$ = '$$P{region}$$' " ;   ;  ("Channel", "asc")
}$$

$$LOOP{
<TR>
<TD>$$P{Channel}$$</TD>
<TD align=center>$$P{"Bar"; " \;"; "chartwidth(250),chartheight(180),minichart(no)"}$$</TD>
<TD align=center>$$P{"Gauge"; " \;"; "chartwidth(170),chartheight(100),minichart(no)"}$$</TD>
<TD align=center>$$P{"Pies"; " \;"; "chartwidth(250),chartheight(120),minichart(no),label(percent),labelcolor(white)"}$$</TD>
<TD align=right>$$P{Last month}$$</TD>
<TD align=right>$$P{Forecast+1}$$</TD>
</TR>
}$$
DownloadsFor evaluation copies, click StarProbe OLAP Download. |

|