|
|
||||||||||||
Sales Trend Analysis and Sales Forecasting - Customer Trend AnalysisSales trend analysis and timely identification of newly emerging customer trends is very important to businesses. Sales patterns of customer segments may indicate market trends. Upward and downward trends in sales signify new market trends. Time-series predictive modeling can be used to identify market trends embedded in changes of sales revenues. Understanding of customer and sales trends is important for marketing as well as for customer retention. Typical customer and sales trend analysis includes;
Sales trend analysis periods can be as follows;
Sales trend analysis may be performed;
In the following monthly sales chart, notice that there are two patterns. First, sales has upward growth trend. Second, sales fluctuates depending on seasons. These two patterns can be captured by time-series regression with seasonal adjustment as described in the subsequent sections. 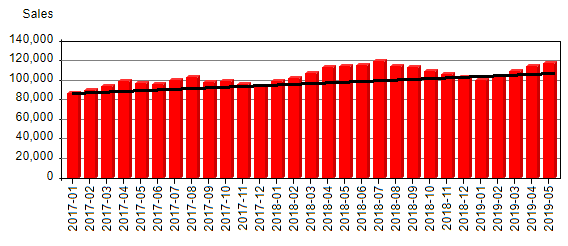
Sales trend analysis and sales forecasting can be very complex. Use of analytic software, such as CMSR Data Miner, is essential.
PSM is a simple customer and sales trend analysis method to manage your most valuable business resources: customers and markets. Profile your customers and markets as suggested in Customer Profiling. Based on profiling, develop customer and market segments. Finally, monitor the following trends;
Sales Forecasting with Time-series RegressionHow can you predict future sales? This can be done with regression. Regression is an analytic technique used in developing predictive models for numerical data. It automatically derives mathematical functions that summarize trends embedded in past historical data. Regression can be applied to sales time-series data. Time series sales forecasting is very important for projection marketing. Based on time-series projections, inventory levels can be maintained efficiently, for example. Retailers and wholesalers can maintain optimal inventory levels based on time-series projections. Manufacturing companies can plan manufacturing capacities. Time-series analysis and sales forecasting is very important. Customer (or market or products) segments have different sales trends. Some segments may be growing, while others are declining. Segment-by-segment sales forecasting can produce very useful market insights. Forecasting can be short term, mid term and long term. Long term forecasting may not produce accurate predictions. However it is very useful in understanding long term market trends. Linear Sales Growth Estimation by Linear Time-series Regression - Sales Trend FormulaLinear sales growth can be best understood with a linear function. Linear sales trend formula is stated as "Y = a + b * X" where "b" is the periodic average increase/decrease amount. "b" is the "Linear growth rate". Note that "X" is the time periods and "Y" is the sales figures. The red line in the following figure shows the linear regression line. "b" represents the linear average growth amount. This method of growth computation is best for linear growth data. If data is not linear, non linear functions should be used. 
Sales Forecasting with Seasonal AdjustmentSales time-series sequence data often contain seasonal patterns. For example, clothing and fruits sales can fluctuate based on season. This hides underlying sales patterns and makes it difficult to project sales figures accurately. Seasonal adjustment is used to overcome this problem. It removes seasonal factors. Time-series regression on seasonally adjusted data can capture hidden patterns. Predicted values on seasonally adjusted data are then converted back to actual values. This process can significantly improve accuracy of predictions. It is noted that to make seasonally adjusted sales forecasting works, multi-year series data is required. At least three years data is recommended. Sales trend analysis with seasonal adjustment is very complex. Use of analytic software, such as CMSR Data Miner, is essential. But it's very easy with CMSR Data miner! Just selecting a proper season size will do automatically. The following CMSR line chart shows sales trend analysis with seasonal adjustment. Slim dim lines represent original sales figures. +++ lines are seasonally adjusted data. Dotted lines show predicted values by seasonally adjusted regression.
Forecasting with Seasonal Adjustment Using Neural NetworkAs an alternative approach to regression, neural network can be used to capture time-series trends and seasonal patterns. Note that regression is limited in terms of information used. Neural network can include other various related indicators. Neural network is a very robust modeling tool. It can capture time-series trends along with seasonal patterns.
Sales Trend Analysis and Sales Forecasting with CMSR Data MinerCMSR Data Miner provides the following tools for sales trend analysis. All support time-series regression with/without seasonal adjustment;
The following figures show examples of group-by-group time-series trend data visualizations. For more information, please read Big Data Analytics. For more about CMSR Data Miner tools, please read Time-series Analysis Tools.
To use Excel data on CMSR Studio, export Excel data as a CSV file. Then import the CSV file from CMSR. Sales Trend Analysis Data PreparationTo analyze sales trends with CMSR Studio, data should be prepared as in the following figure;
Required data fields are as follows;
Data records don't need to be unique. CMSR will aggregate them. Data can be stored as SQL relational database tables. Alternatively data can be prepared as text files and imported into CMSR Studio.
Excel Sales Trend Analysis and Sales Forecasting: Excel Group-by Add-in ToolRosella Group-by Excel Add-in provides powerful simple-to-use tools for trend analysis. It combines group-by aggregation with time-series predictive modeling using regression. It employs powerful linear and non-linear regression. Currently it supports 16 different mathematical functions using advanced function fitting algorithms. It also support seasonally adjusted regression. The following figure shows an example of Rosella Groupby Add-in reports with time-series analysis. (For full-size view, click the image.)
Free Download: Group-by Excel Addin Tool for Trend Analysis and ForecastingFor free license copy of this Excel Addin, click Download Rosella Excel Addin. After installing, enter this license key "G2022021520300215D4D7D7D7D1" from "Lincense control" menu. |

|
|||||||||||