|
|
|||||||||||
|
| Home | DataMining & Machine Learning | Products & Downloads | Site Map | Contact | |
|||||||||||
Rosella BI Server Platform for Predictive Modeling and BIRosella BI Server is a web-based business intelligence development platform. It provides various BI functions over the web using user-written html template pages, such as executive dashboards, pre-defined management reports, etc. The most important function is to deploy CMSR models on the web for a large number of users. BI Server supports three ways to deploy CMSR models;
Supported models are RME-EP (including Deep Learning) models, SOM, neural network, decision tree, regression, and co-items cross-sell models. BI Server is based on Jakarta/Java EE and can be operated on all major operating systems such as Windows, Linux, Mac OS X, Solaris, etc. It runs on high efficiency. Note that Rosella BI sever is run on Java EE application servers such as Apache Tomcat, Resin, WebSphere, etc. For Amazon AWS deployment tips, please read Set up an amazon ec2 instance with tomcat and Deploy java application with ec2. On Microsoft Azure deployment, please read Deployment on Azure. BI Server has advanced Model Instance Managers which provide model services to accelerate evaluation speed. (1) Standard Deployment of Models using Standard InterfaceThis is the simplest deployment method of CMSR models. The following figures show input and output interfaces. Models (along with html help pages) are copied into system directories. BI Server automatically generates interfaces based on input and output variables. The first figure shows an example of input interface. The second is an example of output report. Users enters input values and then press the "Evaluate" button. Then the second screen appears.
(2) HTTP/JSON Requests from Other ApplicationsThis is for applications running on non-Jakarta/Java EE platforms. Applications simply request services using HTTP protocols. Data is exchanged using JSON format. This is highly efficient. BI Server can process over 5,000 HTTP requests per second. (3) API Calls from Jakarta/Java EE JSP ProgramsThis is for Jakarta/Java EE JSP programs. Simple method/procedure API calls are provided to evaluate data over models. Programs are normally written in JSP, deployed along with BI Server. HTML Templates based Rapid Development of Intelligent ReportsTypical BI applications can consist of hundreds of simple and complex reports or dashboards that may contain charts with predictive statistics. Developing such systems can require huge manpower and time. BI server platform provides an advanced platform on which complex applications can be developed and deployed very rapidly, resulting not only significant cost reduction but also with sophisticated analytics incorporating RME-EP models. Reports are based on HTML codes incorporating embedded macros. What is Knowledge-Embedded Predictive Reports?Knowledge-Embedded Predictive Reports can improve business visibility harnessing business reports with predictive modeling and business logic using RME-EP rule engines. For example, KPIs can analyze changes in business drivers and co-inference them automatically to detect hidden patterns underneath complex numbers. KPR's incorporate predictive modeling with rule-based expert systems into report writing and charting systems;
Incorporation of predictive analytics and rule-based expert systems into business reports provides a number of advantages. It will make business reports much easier to comprehend potential problems and successes. Trends developing can be detected early so that actions can be followed as early as possible. Complexity in interpreting KPIs is removed in real-time by embedded knowledge of business experts. 
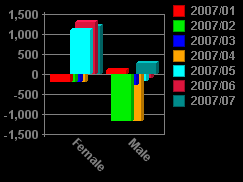
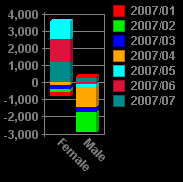
Data Visualization ChartsRosella Analytic BI Platform produces high-quality graphics and reports that can be used in executive dashboards analytic reports.
|

|
||||||||||