|
|
||||||||||||
Share / Equity Trading and Trend AnalysisThe art of equity (shares, futures, bonds) trading hinges upon how you can ride the trends in share prices. Share prices generally fluctuate. Understanding patterns in price fluctuation can make investors hugely advantageous. Bellwether Stock InvestingA bellwether stock is a stock perceived to be a leading indicator of an industry or a sector. Depending on rise and fall of a bellwether stock, other correlated stocks also rise and fall. Investors often use this as a guidance for buy and sell. These associated stocks can be easily identified from stock prices data. Next section explains this. Finding Stocks that Rise and Fall in SyncFinding stocks that rise and fall in synchronization can reveal useful investment information. This can be detected using time-series regression techniques. The following figures show seven time-series trend charts. Consider the three time-series trends of the left figure. The first two series have identical positive growing trends. As the first series values rise, the second series values also rise. The third has opposite trend. As the values of the first series rises, the values of the third series decrease. This type of co-relationship is very common in business data. These three are correlated! The first and the second are positively correlated. The third is negatively correlated with the first and the second. Now consider the two series of the middle figure. Although not related in linear fashion, two values rise and fall together. That is, they are also closely correlated.
Consider the two series of the right figure. Notice that the second series values resemble the first series values with one period later. That is, one period time shift or time lag pattern. Second pattern occurs after one period lag. This this is also very important co-relationship.
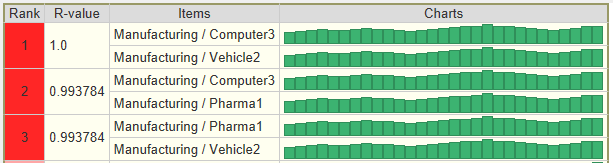
CMSR Studio Time-series Similarity
analysis tool is developed for this type of analysis. The following is an example of output.
Stock pairs that rise or fall simultaneously are ranked and displayed.
Predictive Modeling and Machine LearningInvestors buy and sell based on information they have. Finding what information investors use in making buy and sell decisions can be done by analyzing past information using CMSR Studio correlation analysis tool. For more on correlation analysis, please read Variable Relevanacy Factor Analysis. Reverse engineering how investors make buy and sell decisions can be done with neural network machine learning. Neural network is a robust modeling tool. It can capture patterns how investors make buy and sell decisions. For more information on neural network, please read Neural Network. Trend Analysis: Profiling big moversProfiling big movers can give you overall equity market trend. Hotspot can generate profiles for big movers. Profiles can be based on company classification, fundamental data, profit and loss, balance sheet, and share price information. Knowing profiles of big movers, you can increase portfolios for rising stocks while reducing portfolios of falling stocks. More specifically, you can sell off stocks that belong to falling groups and buy those in rising. Profiles can be based on daily, weekly, monthly, quarterly and yearly changes. This will provide short to long term patterns of big movers. Investors who know the market trends will be able to invest smarter, increasing profit while reducing risks. For example, an equity investment firm wishes to know profiles of companies that lost most share values in percentage terms during the last six month. The following shows a possible result that might be used to identify potential risk of companies. 
In addition, this can be used to identify profiles of companies whose market values have risen most rapidly during the last three days, and so on. |
|
|||||||||||