|
|
|||
Deviation Analysis and Deviation DetectionDeviation analysis can reveal surprising facts hidden inside data. CMSR Data Miner provides tools that can be used to detect deviations, anomalies, and outliers. Detection is needed for various reasons;
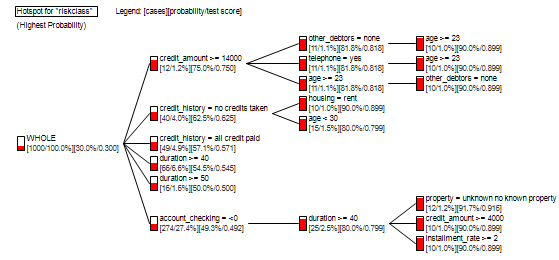
Hotspot AnalysisHotspot Analysis can drill-down data, detecting outliers. More specifically, this will detect patterns of outliers, defined in terms of profile conditions. Outliers can have extremely high or low averages, probabilities, etc. With CMSR Data Miner, you can perform as follows;
The following figure shows CMSR Hotspot Analysis drill down tree for credit risk data. Information is drilled down by refining data for search of higher credit risk segments. 
Predictive Modeling (by Machine Learning) and Anormaly DetectionPredictive Modeling, such as decision tree, regression, rule induction and neural network, can be used to detect deviations. Principal idea is to develop AI machine learning models that can predict general expectations. Then compare values against AI generated expected values. If differences in values are large, anormalies are detected. With CMSR Data Miner/Machine Learning Studio, this works as follows;
Another approach is to use models that can predict anormaly directly as follows;
Cross Tables and Hidden PatternsCMSR Data Miner supports very powerful deviation detection methods for Cross Tables. It shows deviation in terms of over performining and under performing cells based on Chisquare statistics. The methods can reveal hidden patterns and hidden information hidden inside cross table numbers. Note that this tool is also available as Excel Addin Cross Tables. ClusteringClustering objects based on similarity and analyzing clusters can reveal more problem entities. With CMSR Data Miner, you can perform as follows;
Deviation Detection in Time-Series Trend DataRule-based automation can be used to detect deviant trends automatically. RME-EP is a rule engine which supports various time-series regression and statistical functions. It's a perfect platform for automation of time-series trend deviation detection. For example, the followings can be implemented easily;
This type of rules can be easily implemented with RME-EP rule engine. It requires KPI data to be stored as a relational database table. In addition, you need to learn SQL style coding. RME-EP is available from CMSR Data Miner/Machine Learning Studio. The following is an coding example. CMSR Download has the full code in the model "KPI Trends Detection Scan" of the "Demo" project. The model implements some above detections. RME-EP can update KPI database table and/or write into a CSV file. More example codes can be found here.
/*
 * If the difference between the current value and the predicted value is
 * bigger than rate-times of the regression average absolute errors.
 */
// evaluation status for big jump, if, 'Yes'
DECLARE "State-BigJump"  AS STRING OUTPUT INITIAL VALUE 'No';

RULE BigJumpDetection:
IF ABS("Current" - TIMESERIES(1, (LINEAR, EXPONENTIAL), 1, "Series")) >
	TIMESERIES(AVG_ABS_ERROR, (LINEAR, EXPONENTIAL), 1, "Series")
	 *  1.5 THEN
	SET "State-BigJump" AS 'Yes'
END;
|
|||
